Note
Click here to download the full example code
Make digits dataset class-imbalanced
An illustration of the make_imbalance()
function to create an imbalanced version of the digits dataset.
# Authors: Zhining Liu <zhining.liu@outlook.com>
# License: MIT
print(__doc__)

# Import imbalanced-ensemble
import imbens

# Import utilities
import sklearn
from imbens.datasets import make_imbalance
from imbens.utils._plot import plot_2Dprojection_and_cardinality, plot_scatter
import matplotlib.pyplot as plt
import seaborn as sns

RANDOM_STATE = 42

# sphinx_gallery_thumbnail_number = -1
Digits dataset
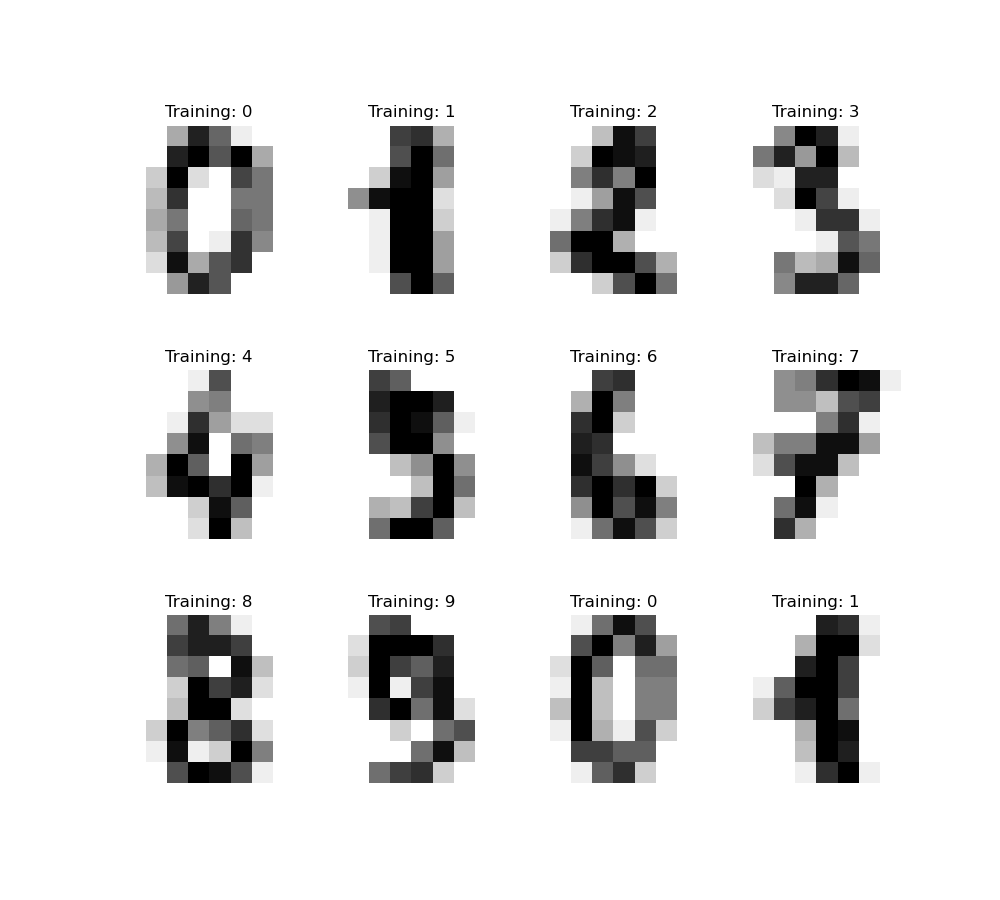
The digits dataset consists of 8x8 pixel images of digits. The images attribute of the dataset stores 8x8 arrays of grayscale values for each image. We will use these arrays to visualize the first 4 images. The target attribute of the dataset stores the digit each image represents and this is included in the title of the 4 plots below.
digits = sklearn.datasets.load_digits()

# flatten the images
n_samples = len(digits.images)
X, y = digits.images.reshape((n_samples, -1)), digits.target

_, axes = plt.subplots(nrows=3, ncols=4, figsize=(10, 9))
for ax, image, label in zip(axes.flatten(), digits.images, digits.target):
    ax.set_axis_off()
    ax.imshow(image, cmap=plt.cm.gray_r, interpolation='nearest')
    ax.set_title('Training: %i' % label)
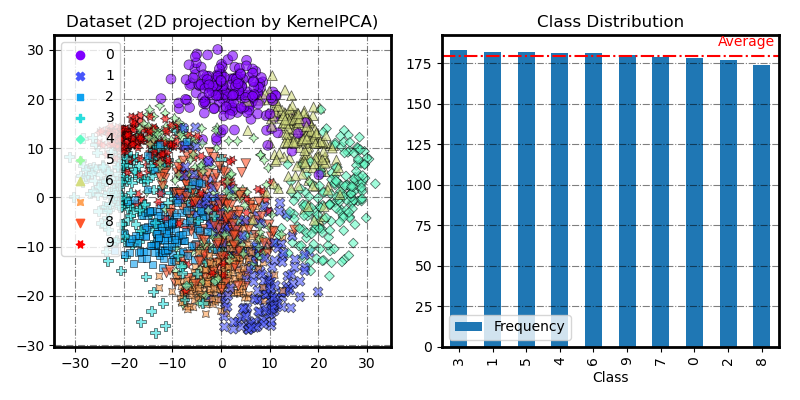
The original digits dataset
fig = plot_2Dprojection_and_cardinality(X, y, figsize=(8, 4))
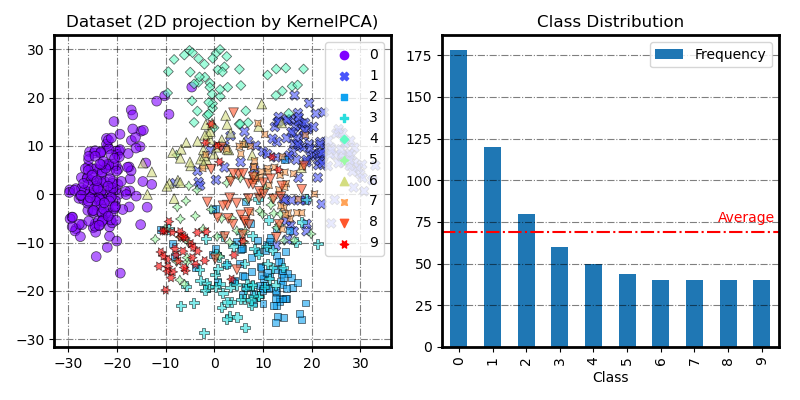
Make class-imbalanced digits dataset
imbalance_distr = {0: 178, 1: 120, 2: 80, 3: 60, 4: 50, 5: 44, 6: 40, 7: 40, 8: 40, 9: 40}

X_imb, y_imb = make_imbalance(X, y, sampling_strategy=imbalance_distr, random_state=RANDOM_STATE)

fig = plot_2Dprojection_and_cardinality(X_imb, y_imb, figsize=(8, 4))
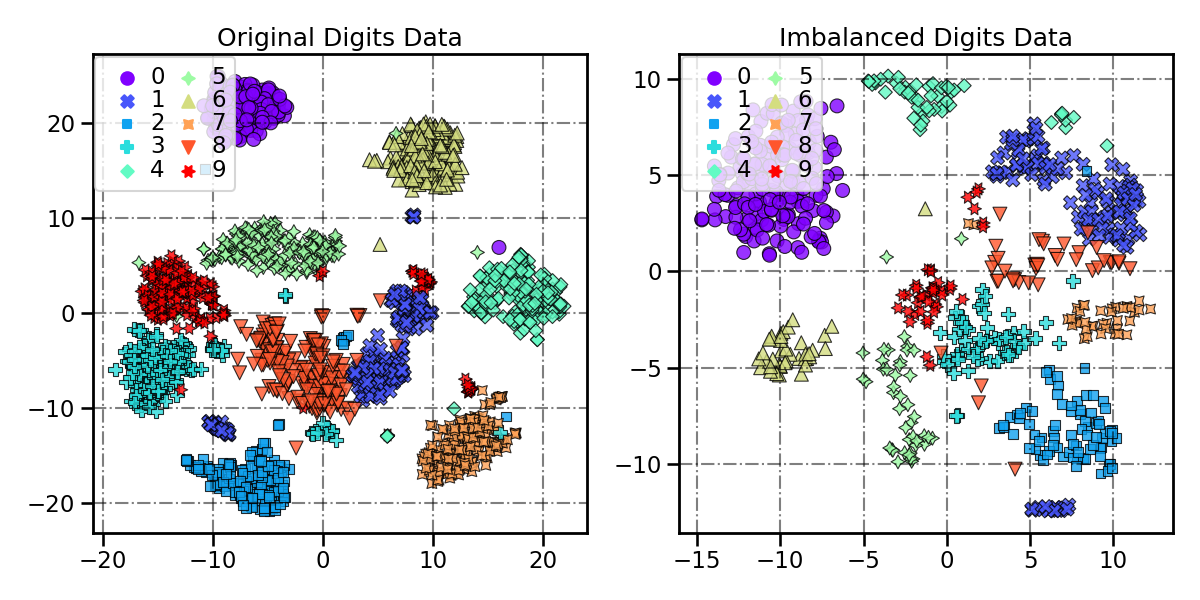
Use TSNE to compare the original & imbalanced Digits datasets
We can observe that it is more difficult to distinguish the tail classes from each other in the imbalanced Digits dataset. These tailed classes are not well represented, thus it is harder for a learning model to learn their patterns.
sns.set_context('talk')

tsne = sklearn.manifold.TSNE(n_components=2, perplexity=100, n_iter=500, random_state=RANDOM_STATE)

fig, (ax1, ax2) = plt.subplots(1, 2, figsize=(12, 6))

# Plot original digits data
plot_scatter(tsne.fit_transform(X), y, title='Original Digits Data', weights=100,
             vis_params={'edgecolor': 'black', 'alpha': 0.8}, ax=ax1)
ax1.legend(ncol=2, loc=2, columnspacing=0.01, borderaxespad=0.1, handletextpad=0.01,
           labelspacing=0.01, handlelength=None)

# Plot imbalanced digits data
plot_scatter(tsne.fit_transform(X_imb), y_imb, title='Imbalanced Digits Data', weights=100,
             vis_params={'edgecolor': 'black', 'alpha': 0.8}, ax=ax2)
ax2.legend(ncol=2, loc=2, columnspacing=0.01, borderaxespad=0.1, handletextpad=0.01,
           labelspacing=0.01, handlelength=None)

fig.tight_layout()
Total running time of the script: ( 0 minutes 7.004 seconds)